

Explore key tools, smart features, and expert insights...

The ChromeOS Readiness Tool Partner Program provides a structured pathway for organizations to become certified experts in ChromeOS migrations. By offering training through relevant resources, the program equips partners to deliver accurate readiness assessments and ensure smooth, secure deployments for their customers.
The journey begins with a simple step: submitting the Become a Partner form on the ChromeOS Readiness Tool website. Once approved, partners receive access to the Partner Portal via the email provided in the application form.
Note: Partner dashboard access is tied to the registered email address, and a single email cannot access both the professional dashboard and the partner dashboard.
Inside the Partner Portal, partners are required to complete a series of certification training modules. These modules provide in-depth knowledge of the ChromeOS Readiness Tool, enabling partners to:
Understand all core features and capabilities
Communicate the tool’s value effectively to customers
Ensure precise readiness assessments and deployment success
Upon completing the training, partners earn official ChromeOS Readiness Tool certification, reinforcing their credibility and expertise.
Certified partners are responsible for setting up the tool for customer environments, following strict usage protocols to maintain accuracy and data visibility:
Initial Test Run – Partners first perform a test run on 4–5 internal machines using the generic setup from the ChromeOS Readiness Tool website. This step builds familiarity before deploying in customer environments.
Executive Summary Report – After testing, partners generate an executive summary to evaluate initial findings.
Partner-Specific Setup – Once testing is complete, the development team provides a customized setup file unique to that partner. Only data collected through this setup appears in the partner dashboard.
Avoid Generic Setup in Customer Environments – The generic setup must not be shared with customers, as it will not feed data into the partner dashboard.
GCP Storage Method – For deployments using Google Cloud Storage, partners must create a storage bucket and assign storage object admin access to the provided ChromeOS Readiness Tool service account and Customer support Account.
ChromeOS Readiness Tool Service Account: storage-access@chromeosreadinesstool.iam.gserviceaccount.com
Customer Support Account: crt-customer-support@codimite.com
This includes access to more detailed insights through the Pro Dashboard.
Enterprise Flow Limitation – Data from customers using the enterprise flow (Windows Server Active Directory with On-premise Storage) will not appear in the partner dashboard.
The ChromeOS Readiness Tool Partner Program offers significant advantages for certified members:
Exclusive Setup File – Ensures accurate data capture and dashboard visibility.
Advanced Dashboard Insights – Access to powerful analytics that enable more informed migration recommendations.
Brand Visibility – Certified partner logos are featured on the ChromeOS Readiness Tool website partner page.
Enhanced Expertise – Comprehensive training builds deep technical knowledge and feature-related knowledge about the ChromeOS Readiness Tool.
Official Recognition – Certification validates expertise in ChromeOS readiness and deployment support. The ChromeOS Readiness Tool Partner Program is more than a certification; it’s a strategic enablement platform. By combining training and dedicated dashboard insights, it empowers partners to guide their customers through seamless ChromeOS migrations while maintaining the highest standards of accuracy and efficiency.

In today’s evolving digital landscape, organizations are under constant pressure to modernize their IT infrastructure while maintaining cost-efficiency, sustainability, and security. Migrating to a cloud-based operating system like ChromeOS offers significant advantages but doing so effectively requires clear visibility into the current environment. That’s where the powerful combination of ChromeOS Flex and the ChromeOS Readiness Tool comes into play.
Together, they empower businesses to extract the maximum value from existing hardware while ensuring a smooth and strategic transition to ChromeOS from day one.
ChromeOS Flex is designed to extend the lifespan of legacy Windows and Mac devices by converting them into fully functional ChromeOS machines. With just a simple installation, organizations can:
Avoid premature hardware refresh cycles
Reduce e-waste by repurposing aging devices
Improve energy efficiency (ChromeOS devices use less energy)
Receive up to years of automatic updates, ensuring long-term performance and security
This makes ChromeOS Flex a smart, sustainable alternative to investing in new hardware.
The ChromeOS Readiness Tool provides the insights needed to make data-driven migration decisions. It evaluates your existing IT environment and delivers clear, actionable assessments across:
Device compatibility
Application readiness
Peripheral support
Using real usage data collected securely and transparently, the tool assigns device readiness statuses that help organizations plan their rollout effectively:
Ready to Switch: Devices are fully compatible and ideal for immediate migration.
Ready with Verification: Devices appear compatible but should be tested further before deployment.
Blocked from Switching: Devices have critical blocker applications with high usage that prevent a successful transition.
This classification eliminates guesswork and allows IT teams to focus resources where they’re most impactful.
When used together, ChromeOS Flex and the Readiness Tool form a powerful migration framework:
ChromeOS Readiness Tool identifies which devices are ready or viable for ChromeOS Flex.
ChromeOS Flex then transforms those devices into modern, cloud-first machines.
This approach enables organizations to maximize the value of their existing IT assets from the very start while avoiding unnecessary capital expenditure on new hardware.
Cost Savings: Reduce hardware procurement costs by extending device life through strategic repurposing.
Sustainability Gains: Cut e-waste and energy use by modernizing instead of replacing devices.
Improved Security: Transition to ChromeOS’s multi-layered security architecture with confidence.
Faster, Informed Rollouts: Use readiness insights to prioritize and streamline migration phases.
IT Efficiency: Reduce IT overhead with simplified device management and longer update cycles.
Beginning your migration journey is simple:
Install the ChromeOS Readiness Tool using the method that best fits your environment either via Enterprise (GPO/Active Directory) or Other deployments flow.
Review readiness dashboards and reports to assess which devices are ready for migration.
Deploy ChromeOS Flex to the most compatible devices and monitor performance through real-time insights.
Visit chromeosreadinesstool.com to schedule a demo or explore how your organization can get started.
Modernizing your IT infrastructure doesn’t have to mean starting from scratch. With ChromeOS Flex and the ChromeOS Readiness Tool, your organization can extend the life of existing hardware, reduce costs, and accelerate the shift to a secure, cloud-first operating model. It’s not just about switching systems, it's about unlocking value from day one.

In an era where cybersecurity threats are increasingly sophisticated and IT environments grow more complex, businesses must prioritize operating systems that deliver both robust security and efficient management. While Windows and macOS have traditionally been the backbone of enterprise computing, ChromeOS a cloud-native OS developed by Google, is rapidly gaining traction due to its inherent security features and streamlined administration. Yet, migrating to a new platform can be daunting. The ChromeOS Readiness Tool is designed to simplify this transition, providing organizations with clear insights and a structured migration pathway.
Security Built from the Ground Up ChromeOS integrates multiple security layers, including verified boot, sandboxing, automatic updates, and data encryption by default. This multi-pronged approach minimizes exposure to malware and cyberattacks without relying heavily on third-party security tools. This reduces the security management burden on IT teams and ensures devices stay protected throughout their lifecycle.
Simplified, Scalable Device Management With ChromeOS, IT administrators benefit from cloud-based centralized management that enables rapid provisioning and control of devices anywhere in the world. Features like zero-touch enrollment and policy enforcement via Google Admin Console allow seamless onboarding and consistent security compliance across thousands of endpoints, eliminating many challenges inherent in managing Windows or macOS fleets.
Cost-Effective and Sustainable Modernization ChromeOS supports solutions like ChromeOS Flex, which enables the repurposing of existing PCs and Macs, extending hardware lifecycle and reducing e-waste. Additionally, ChromeOS devices consume significantly less power and receive automatic updates, combining financial savings with environmental responsibility.
Cloud-Centric Collaboration and Accessibility Built for the cloud era, ChromeOS tightly integrates with Google Workspace tools such as Gmail, Google Meet, and Google Drive, empowering employees to collaborate securely and efficiently from any location or device, aligning with modern hybrid work models.
Understanding the benefits of ChromeOS is one thing, executing a smooth and secure migration is another. The ChromeOS Readiness Tool is a comprehensive assessment platform that evaluates your current IT environment’s compatibility and readiness for ChromeOS adoption. By analyzing applications, devices, peripherals, and user behaviors, CRT delivers actionable insights to reduce migration risks and accelerate deployment.
Clear Visibility and Streamlined Planning: The tool provides a detailed inventory and compatibility status of existing hardware and software, eliminating guesswork and helping IT teams prioritize migration efforts effectively.
Enhanced Security and Data Privacy: Encrypts all collected data protocols, ensuring sensitive information stays secure and accessible only by authorized personnel. Its design respects organizational security policies throughout the migration process.
Flexible Deployment Options: Whether your organization leverages on-premise Active Directory infrastructure or cloud-based Unified Endpoint Management, ChromeOS Readiness Tool supports multiple installation flows tailored to your environment’s needs.
Comprehensive Reporting and Recommendations: The intuitive web dashboard offers a high-level readiness score, device and peripheral insights, browser compatibility reports, and identifies applications that may require virtualization, helping IT teams make informed decisions.
As enterprises face mounting pressures to secure their IT infrastructure while simplifying management, ChromeOS emerges as a compelling alternative to traditional operating systems. Its cloud-native architecture, security-first design, and streamlined administration empower organizations to modernize with confidence.
The ChromeOS Readiness Tool plays a pivotal role in transforming what might seem like a complex migration challenge into a manageable, data-driven process. By leveraging ChromeOS Readiness Tool, organizations can confidently embrace ChromeOS, unlocking enhanced security, simplified device management, and cost-effective scalability tailored for the demands of today’s digital enterprise.

In today’s fast-evolving IT landscape, enterprise IT auditing is essential for maintaining security, compliance, and operational efficiency. A clear view of your technology assets supports informed decision-making particularly during OS migrations and digital transformation initiatives. The ChromeOS Readiness Tool enables this by offering detailed insights into application usage, device readiness, browser activity, and more, streamlining the auditing process.
The ChromeOS Readiness Tool is a compatibility assessment platform that provides a holistic view of your organization's IT environment. Its features enable IT teams to:
Streamline auditing processes through automated data collection
Gain visibility into device and software usage
Improve security and compliance posture
Optimize costs by identifying redundancies
Enable data-driven migration planning
Understanding how applications are used is a core part of IT auditing. The Readiness Tool delivers:
Foreground vs. Background App Insights: Identify which applications are actively used versus those running in the background.
Application Readiness Categorization: Apps are labeled as ChromeOS-ready, Possibly Ready, Blocked, or Unknown based on compatibility.
Rationalization Opportunities: Possibly ready or incompatible apps can be considered for retirement, replacement, or virtualization through Cameyo.
Effective IT auditing requires accurate knowledge of device health and compatibility. The tool supports this by providing:
Detailed Device Data: Includes model, peripheral integration, and compatibility status.
Device Status Classification:
Ready to Switch – Fully compatible
Ready with Verification – Requires further testing
Blocked from Switching – Incompatible due to app dependencies
Peripheral Readiness Overview: Insights into readiness status and distribution of connected peripheral devices.
The tool includes a dedicated Browser Insights feature, providing:
Extension and Browser Usage: Tracks usage across major browsers (Chrome, Edge, Firefox, etc.) and identifies installed extensions.
Security Visibility: Flags risky and outdated browser extensions, improving security oversight.
Simplified auditing is possible through the tool’s web-based dashboards:
Pro and Partner Web Dashboards: Tailored for companies and partners or service provides with customers/clients of their own
Real-Time Data: Readiness scores, app usage, device assessments, browser insights, and virtualization suggestions are all displayed in one place.
Clear Visualizations: Helps non-technical stakeholders understand key readiness indicators.
Audit teams can export data and integrate findings with broader business tools:
Excel and Pdf Based Reporting: Downloadable raw data files for app usage, device status, and peripherals.
BI Compatibility: Easily imported into platforms like Looker, Tableau, or PowerBI for advanced analysis and visualization.
Security and compliance are foundational to the Readiness Tool:
Data Control: All data remains within your organization’s environment in the network shared folder.
Encryption Standards: Ensures encryption for secure data collection and transfer.
Access Restrictions: Only authorized personnel can access the web dashboards.
GDPR Alignment: A dedicated compliance and data security report demonstrates adherence to privacy laws.
The Readiness Tool helps organizations identify areas to reduce IT costs:
Unused Software Application Identification: Filter low-usage or non-essential apps.
License Rationalization: Reduce spending on underutilized tools.
Faster Migrations: Early issue identification prevents delays and minimizes downtime.
Beyond auditing, the tool sets the stage for long-term transformation:
Migration Roadmap Creation: Based on collected data, organizations can create a customized migration plan.
Future-Proofing IT: Enables transition to scalable, cloud-first infrastructure with ChromeOS or ChromeOS Flex.
Modern IT Enablement: Supports rapid deployment, simplified management, and enhanced security for enterprise environments.
The ChromeOS Readiness Tool empowers organisational leaders with the data they need to audit, optimize, and evolve their infrastructure. By providing rich insights into application behavior, hardware readiness, and browser usage all within a secure, automated framework it transforms IT auditing into a strategic advantage.
Whether preparing for a migration or looking to rationalize IT assets, the tool ensures that organizations can move forward with confidence, clarity, and control.

The ChromeOS Readiness Tool Partner Program equips certified partners with the resources, training, and insights needed to help organizations transition to ChromeOS efficiently. To ensure successful deployments and complete visibility on the partner dashboard, partners must follow a precise onboarding and setup process.
This guide outlines the key partner guidelines for using the ChromeOS Readiness Tool effectively.
To join the program, companies must complete the “Become a Partner” form on the ChromeOS Readiness Tool website.
Access to the Partner Portal is granted to the email address provided in the form.
Use a dedicated email address for partner activities, as one account cannot access both the partner dashboard and the pro dashboard which might be needed during the internal test run.
Before deploying the tool to customers and after the partner portal module completion:
Run the generic setup on 4–5 internal machines.
This initial test helps partners understand the tool’s operation and data collection process.
After testing, it is required to generate an executive summary report, for the Partner specific setup to be awarded.
After completing internal testing and report generation, the development team will issue a partner-specific setup file.
Only this customized setup should be shared with customers, as it ensures data appears on the partner dashboard.
As a partner sharing the generic setup will prevent customer data from being visible in the partner dashboard, resulting in lost insights.
Before customer deployment, partners using the GCP storage method must create a GCP storage bucket and grant storage object admin access to the specified accounts.
ChromeOS Readiness Tool Service Account: storage-access@chromeosreadinesstool.iam.gserviceaccount.com
Customer Support Account: crt-customer-support@codimite.com
Using GCP storage during internal testing also provides access to the Pro Dashboard for more detailed insights. As the Webdashboards are available only for the GCP storage option.
Once certified and fully set up:
The partner’s logo is displayed on the ChromeOS Readiness Tool Website Partner Page, increasing visibility and credibility.
Access to the partner-specific dashboard enables delivery of precise, data-driven insights to you, as partners.
If customers use the Enterprise Flow (Windows Server Active Directory with On-premise Storage), their data will not appear on the partner dashboard as the data will only be shared internally within the organization.
Following these guidelines ensures that partners can deliver accurate readiness assessments, maintain secure and organized data management, and leverage the ChromeOS Readiness Tool to its full potential, ultimately helping customers transition to ChromeOS with confidence.

As enterprises adopt cloud-first strategies, security remains a critical consideration, especially during major IT transitions like migrating to ChromeOS. Designed with a secure-by-default architecture, ChromeOS offers built-in protections. The ChromeOS Readiness Tool further supports this transition by helping organizations plan securely and assess readiness without compromising data privacy.
ChromeOS is inherently secure, thanks to:
Verified Boot – Ensures OS integrity at startup
Sandboxing – Isolates processes to prevent system-wide compromise
Automatic Updates – Reduces exposure to known vulnerabilities
These features minimize the need for third-party security tools and reduce attack surfaces across the enterprise.
The ChromeOS Readiness Tool strengthens your migration approach through:
Assessment data is:
Collected locally on user devices
Uploaded only to trusted locations of the organization itself (Network Shared Folder or GCP Storage Bucket)
Never uploaded to external storages without explicit configuration and admin permission
This ensures full control over sensitive information.
The tool uses strong encryption protocols:
Encrypts log files on the local device
Access is granted only via the private key held by the deploying user
Only users with the unique private key can access readiness data on the dashboard. Data in network folders is permission-controlled, ensuring only authorized users have access.
The built-in Browser Insights feature helps:
Monitor browser versions and extension usage
Detect unauthorized or risky extensions
Enforce compliance through admin-approved data collection
To ensure a secure migration to ChromeOS:
Protect Your Private Key: Store the generated key securely, as it’s required to decrypt and access readiness data
Use Encrypted Storage: Choose secure storage locations like GCP Cloud Buckets with proper roles or internal network shares with restricted access.
Control Access Permissions: Ensure only designated personnel have access to collected data.
Regularly Review Browser Insights: Continuously monitor extension and browser usage to flag potential threats early.
With the ChromeOS Readiness Tool, enterprises can migrate confidently without compromising security. By applying these best practices, you ensure data privacy, reduce exposure to threats, and maintain full control throughout the migration journey.

In today’s regulatory landscape, data privacy and compliance are critical priorities for every organization. As enterprises adopt cloud-native platforms like ChromeOS, ensuring that data handling and security practices meet standards such as GDPR is essential to maintaining stakeholder trust and minimizing compliance risks.
The ChromeOS Readiness Tool is designed with a strong emphasis on data security and privacy, providing organizations with a secure, transparent, and compliant assessment of their IT environment.
A key principle of the ChromeOS Readiness Tool is that all collected data remains securely within the organization, preventing unauthorized external access. This foundational approach reassures businesses that sensitive information is handled with the utmost care.
The tool employs robust encryption protocols to safeguard data:
Log files are encrypted locally using encryption keys.
These keys are further protected by encrypting them with the public key, ensuring only authorized servers can decrypt and access the data.
Access to stored assessment data is strictly limited to authorized personnel, with employee permissions carefully controlled.
To enhance data confidentiality, users must upload a private key generated during deployment to access readiness results via the web dashboard. This mechanism guarantees that only those with the appropriate credentials can view sensitive information.
While explicit GDPR compliance documentation (https://drive.google.com/file/d/1_hiijacQLSuSo_vJuTMvCMa92-fb5q3b/view) supports the tool’s design, its multi-layered security measures align with core privacy principles, reinforcing organizations’ ability to meet regulatory requirements. By securing data within the organizational boundary, enforcing strict access controls, and implementing end-to-end encryption, the ChromeOS Readiness Tool helps build a trusted framework for migration.
This approach not only mitigates compliance risks but also instills confidence among stakeholders, employees, customers, and partners that sensitive data is protected throughout the digital transformation journey.
By integrating the ChromeOS Readiness Tool into your migration strategy, organizations gain critical visibility into their IT landscape while upholding the highest standards of data privacy and compliance. This foundation of trust and security is vital for a successful and sustainable transition to ChromeOS, enabling enterprises to embrace the future of cloud-native computing confidently.
The deployment of IT tools across diverse enterprise environments can often be more challenging than anticipated. One recurring hurdle for IT teams has been the compatibility limitations of Unified Endpoint Management (UEM) tools, especially when it comes to deploying solutions that rely on PowerShell.
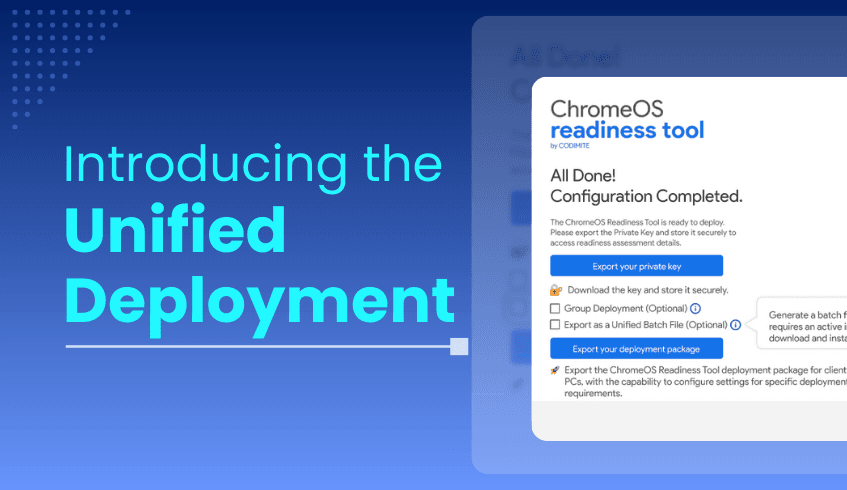
Recognizing this challenge, the latest release of the ChromeOS Readiness Tool brings a game-changing solution, the Unified Deployment Package. This update is designed to streamline, simplify, and accelerate deployment, making the process smoother for IT administrators across various environments.
In many organizations, UEM tools are central to managing devices and software deployments, often leveraging PowerShell to get the job done effectively. While PowerShell works well for many environments, we now offer an additional, streamlined deployment option for the ChromeOS Readiness Tool. This gives IT teams more flexibility, making it easier
The Unified Deployment Package introduces a compatible, batch-based installation method, ensuring that deployment is no longer restricted by PowerShell support limitations, if there were any.
Instead of relying solely on PowerShell scripts, the Unified Deployment Package uses a batch file for installation. This approach ensures compatibility with a wide range of UEM tools, even those that do not support PowerShell.
The package delivers one unified setup file that combines both the PowerShell script and the MSI (Microsoft Installer) file into a single, easy-to-use unit. No more juggling multiple files or worrying about missing components during installation.
By being designed to work with batch-compatible UEMs, this package removes the need for custom scripts or workarounds. It works seamlessly in environments that were previously challenging for ChromeOS Readiness Tool deployment due to PowerShell-based UEM issues.
With fewer manual steps, the risk of deployment errors is significantly reduced. This not only boosts reliability but also ensures a smoother rollout process across multiple devices.
The streamlined process means faster deployments and less time spent troubleshooting, allowing IT teams to focus on more strategic tasks instead of wrestling with setup issues.
A common deployment barrier is missing prerequisites. The included batch script automatically checks for and installs the required .NET Desktop Runtime, ensuring the readiness tool works immediately without additional manual intervention.
The Unified Deployment Package is included in the latest release of the ChromeOS Readiness Tool and can be found under the “Other Deployment Options” flow. Whether you manage a small IT environment or a large enterprise network, this new package ensures a more compatible, efficient, and reliable deployment experience.
The Unified Deployment Package is more than just a new installation method, it’s a strategic upgrade that addresses real-world deployment challenges. By combining universal compatibility, reduced complexity, and built-in automation, it allows IT teams to deploy the ChromeOS Readiness Tool faster, with fewer errors, and without PowerShell limitations.
This update reflects ChromeOS Readiness Tool’s ongoing commitment to empowering IT administrators with tools that are practical, scalable, and ready for diverse enterprise needs.

Modernizing IT infrastructure and moving to cloud-first environments like ChromeOS requires more than just a vision; it demands a clear understanding of your current landscape. The ChromeOS Readiness Tool plays a critical role in this transformation, offering detailed insights that help organizations translate raw compatibility data into actionable migration strategies and information.
The ChromeOS Readiness Tool is a comprehensive compatibility assessment platform. It captures essential data from your existing IT environment including application usage, device specifications, and peripheral integrations providing a data-driven foundation for planning your ChromeOS migration.
By eliminating assumptions and presenting factual insights, the tool sets the stage for a seamless and informed transition.
The tool categorizes applications and devices based on their compatibility with ChromeOS:
Application Readiness:
ChromeOS Ready – Fully compatible and migration-ready.
Possibly Ready – Likely compatible, but may need additional configuration where some features may not work as it is with ChromeOS.
Blockers – Incompatible and require remediation or replacement.
Unknown – Currently under analysis and updates are regularly added to the tool’s database.
Device Readiness:
Ready to Switch – Fully compatible and suitable for immediate migration.
Ready with Verification – Mostly compatible but require validation through testing as some applications may not work to full potential.
Blocked from Switching – Limited by critical dependencies or incompatible apps.
These classifications help IT teams quickly identify migration candidates, organize devices by readiness level or department, and create effective groupings for phased rollouts.
With clearly defined readiness statuses, organizations can move from assessment to execution:
Migrate immediately those devices marked "Ready to Switch" and apps listed as "ChromeOS Ready."
Evaluate and test apps labeled as "Possibly Ready" to prepare them for deployment.
Plan ahead for blockers using virtualization tools like Cameyo, which can help run legacy applications in a ChromeOS environment.
This clarity allows for the development of targeted strategies that reduce downtime and improve user experience during the transition.
Once readiness data is analyzed, a step-by-step migration roadmap can be developed:
Phase 1: Migrate what’s ready – Begin with devices and applications already deemed fully compatible to demonstrate early success.
Phase 2: Pilot with confidence – Test "Ready with Verification" devices and "Possibly Ready" applications in a controlled environment and decide if the unavailable features of the applications are essential for the organization’s tasks.
Phase 3: Resolve blockers – Address incompatible apps with replacements or virtualization and schedule these users for later phases.
This structured approach ensures that each phase builds on the success of the last while minimizing operational risk.
Migration is not a one-time project, it’s an evolving process. The ChromeOS Readiness Tool provides ongoing support through its real-time, web-based dashboard, offering:
High-level readiness scoring
In-depth breakdowns of devices, applications, peripherals, and browser environments
Exportable reports for deeper analysis using platforms like Power BI, Looker, or Tableau
You can also access historical data to track progress over time and refine your roadmap based on emerging insights or changing business needs.
Although the tool is data-focused, its features naturally support collaboration. Detailed reporting, clear statuses, and downloadable insights make it easy for IT teams to work closely with stakeholders across departments.
The Pro Dashboard and Partner Dashboard offer tailored visibility:
Pro Dashboard: Enables internal IT leaders to manage and monitor their organization’s readiness journey.
Partner Dashboard: Allows partner organizations to manage multiple clients, securely viewing each company’s readiness data.
This shared visibility improves communication, aligns stakeholders on next steps, and ensures decisions are grounded in real-world data.
The ChromeOS Readiness Tool goes beyond analysis, it empowers action. By leveraging its insights, organizations can confidently navigate the complexities of migration, prioritize efforts based on real data, and create a clear, phased roadmap to ChromeOS.
With the right strategy and tools, digital transformation isn’t just possible, it's inevitable.